![]()
In macOS 13.0 Ventura, Apple released a new command-line utility called eslogger. This utility enables capturing Endpoint Security Framework (ESF or ESAPI) events as JSON. We will not spend cycles in this post describing ESF as it has been discussed in multiple security blog posts over the last 3 years including Mandiant, WithSecure and Objective-See to name a few. Herein we will refer to ESF as Endpoint Security (ES) events or simply events.
eslogger records ES events to either stdout or oslog. Each stdout event displays as a single line JSON object. That means it’s a bit hard to visually parse quickly. At least for us.
Enter, ESEV (Endpoint Security Event Viewer) pronounced E-sev, a UI that allows slicing, dicing and viewing Endpoint Security events that have been captured by eslogger. Ultimately, we wanted an ES events analyzer that was App Store approved. Previously this was impossible because capturing ES events requires a non-App Store friendly entitlement, com.apple.developer.endpoint-security.client. eslogger now makes it possible to capture those events natively in macOS – allowing the analysis application to be App Store approvable.
ESEV simplifies:
- Exploration of macOS Endpoint Security
- Detailed malware analysis
- Diving into macOS internals
- Troubleshooting applications and system interactions
- and more…
Overview
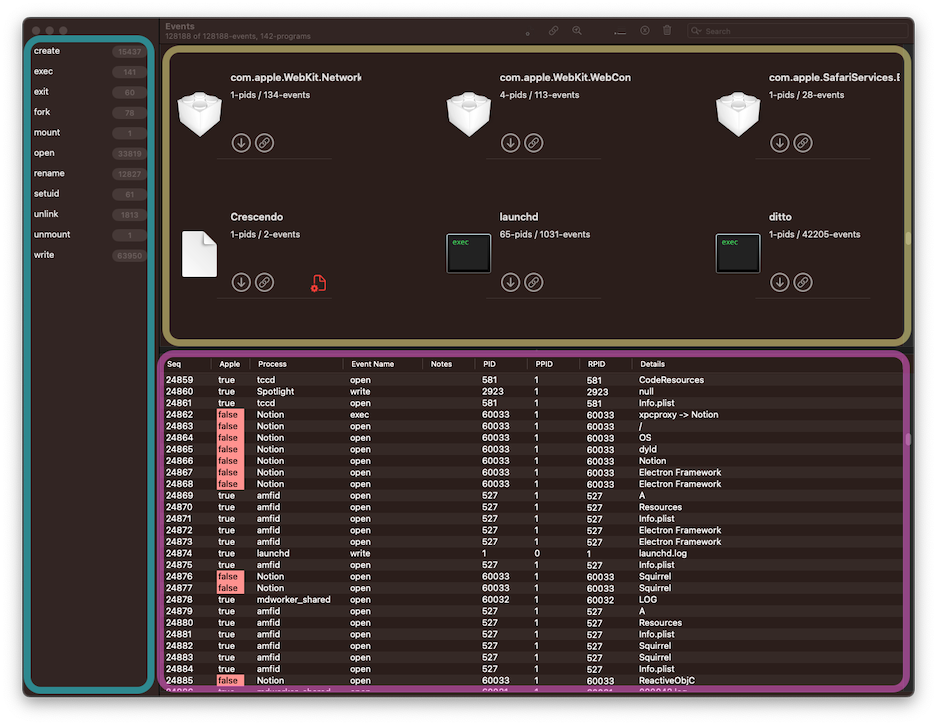
There are three major sections in ESEV. The Event Types are shown in the blue section along the left. These are the events requested from eslogger. The Executables are listed in the yellow section on the top right. This provides a quick view of each discovered executable. The final section displays a list of events, outlined in purple on the bottom right. The events displayed here will change depending on the filter criteria, detailed in the next section. Hovering over any given cell may display expanded details like a full path. Double-clicking on a row will display the full event JSON.
Filtering
Event Type
ES event type filtering is alongside the left-hand pane. To only show certain event types select one or multiple. This will change the events displayed in the list to the bottom right.
They can be individually de-selected using ⌘ + click.
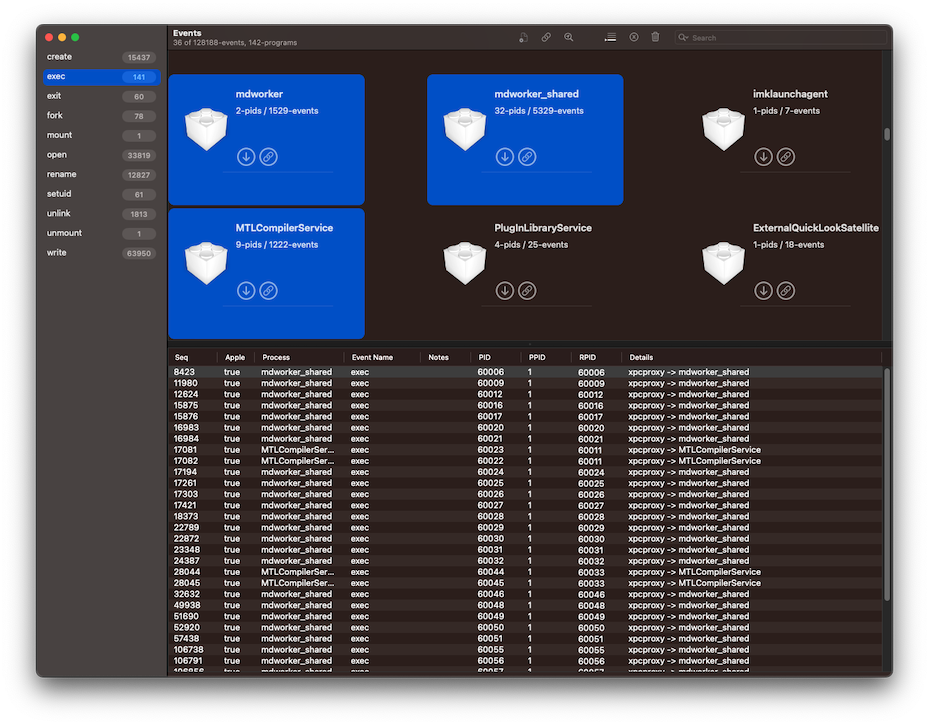
Executable
Filtering by executable (or program) is located in the top-right section. By selecting one or more of these you will show only the events for the processes associated with the selected executables. Something to remember in this view is that one application, like Xcode, may be composed of multiple executables and those will each show separately in this view. One executable may have many processes (or PIDs) and that is shown in the executable tile as #-pids / #-events. Like above, they can be individually de-selected using ⌘ + click.
Non-Apple Programs
Apple refers to their own programs as is_platform_binary inside the JSON event. Users can opt to remove Apple programs from view by toggling the button shown below. The caveat, we discovered even though Apple’s documentation says:
one signed with Apple certificates,
this doesn’t mean ALL Apple certificates. This means you’ll see some programs, like Pages, will show up as a non-Apple binary. More to come about this in a future post.

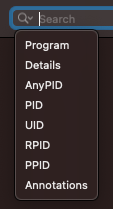
Term Search
Located in the top right this provides filtering events for PID, PPID, RPID, AnyPID, UID (euid), Program Path, Details and Annotations. There is a small drop-down triangle in the search box that allows selecting which one you’d like to search for. The default is Program Path. Currently, it only supports searching for one term at a time.
You can search for multiple values at once by separating each with a comma (,). For example, if you wanted to search for multiple PIDs you could provide the search term: 518,10004,23496. In that case, ESEV will search for any event that matches PID 518 or 10004 or 23496. Annotations that you can search for are the ALL_CAPS names found below in the section titled Annotation.
Annotation
During event capture, ESEV annotates events looking for those that match pre-set criteria. When a match is found the event is annotated and these annotations are visible in the Notes column of the events table. This feature is currently limited and can only annotate the following findings:
-
PRIVILEGED_PATH - 🛤️ A path associated with the event is something worth “noting”. Most of these are persistence related like LaunchDaemons, crontab or loginwindow.plist.
-
PRIVILEGED_USER - 👑 An event has an effective user of root
-
QUARANTINED_PATH - 😷 Certain files are quarantined like executables downloaded by Safari. This annotates events that set quarantine attributes for a file. This requires setextattr and/or deleteextattr event capture. This works for quarantine, set using “xattr -w/-d”, it does not capture those set through Launch Services (LSQuarantineEnabled).
Selecting the magnifying glass will filter events that have any form of annotation.

Analysis
PID Chaining
PID Chaining selects ES events surrounding a given PID. First, select an event in the list of events table. ESEV will use the PID from the selected event to locate the following chained events:
- All events with the selected PID
- All events for the parent PID (RPID and PPID) [except PID 1]
- All events from child processes of the selected PID
Not chaining PPID and RPID of 1 (to a PID of 1) helps to reduce the clutter of listing all the ES events created by launchd when chaining. There are a lot. It’s important to remember they’ve been reduced out as you might be expecting to see them.

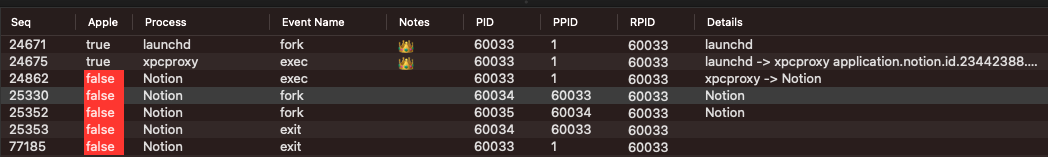
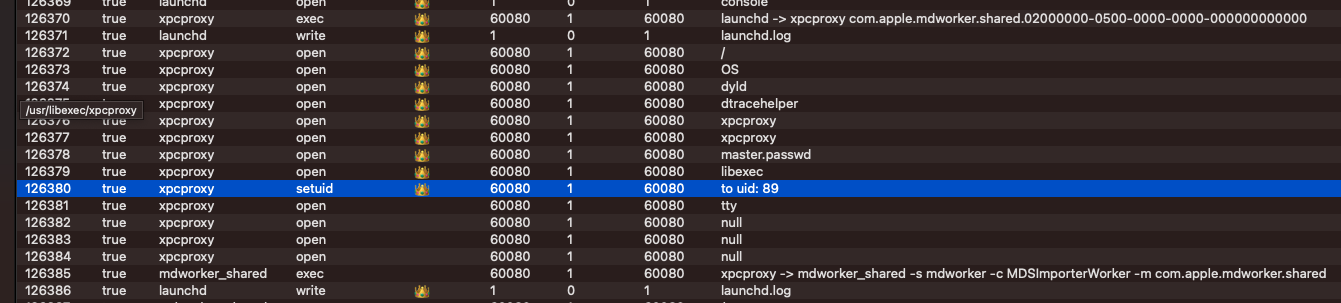
Below is an example of PID Chaining the event with sequence number 25330 which has a PID of 60034. We can see this locates the parent process (60033) and shows fork-exec life cycle of launching a program on macOS:
fork -> exec -> exec
The lifecycle starts with launchd which forks and then execs xpcproxy which then execs Notion.
While looking for a good explanation of PPID vs RPID to link into this post we discovered a great description by The Mitten Mac. Recommend reading for details on “the what and why” of PPID vs RPID. They also had great posts explaining the lineage of processes on macOS. Highly recommend anyone looking to go a level deeper explore ALL the posts and tools on their site. A future ESEV feature may be graphing event lineage but would like to ack that we see The Mac Mitten has already done something along those lines with one of their tools.
Although, The Mitten Mac wasn’t the inspiration for the PID Chaining feature we do want to acknowledge they have multiple tools with a similar feature. Check out MonitorUI and TrueTree.
Time Warp
The name is more exciting than the feature, but this allows displaying only the events that occurred within a given time window surrounding a selected event. Time warp is additive with filters, so if you’ve filtered the view it’ll only show filtered events within the time window. Warping is accessible by right-clicking the event you’d like to warp around.
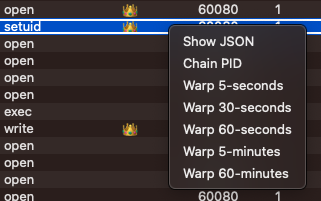
Here is an example of events warped around a setuid call made by xpcproxy.
Acquiring ES Events
ESEV is designed to read events captured using eslogger.
Existing File
For when you’ve already captured events into a file (ex. redirecting stdout). This is great for long-term storage of event data or sharing events between different computers.
nub@nubtop ~ % sudo eslogger fork exec exit > eslogger.events.json
Password:
^C
nub@nubtop ~ %
The example above shows capturing process-related events into a file name eslogger.events.json. That file can then be opened using ⌘+O and analyzed in ESEV.
Real-time Tail
This is useful if you’d like to explore events in real time as they are occurring. Start eslogger emitting events to a file in a terminal window:
nub@nubtop ~ % sudo eslogger fork exec exit > eslogger.tail.json
Password:
Leaving this running, in ESEV use ⌘+T to open the eslogger.tail.json file you created in the terminal window. Events will begin streaming into the interface. When viewing events in real-time the “Auto Scroll” button may be helpful to keep the most recent events in view or may be annoying if you’re trying to explore events. So toggle that button as desired.

Be mindful of the number and rate at which events are being generated. Currently, events cannot be trimmed in a rolling buffer fashion like Crescendo.
This feature utilizes JAMF’s Subprocess Swift library.
note originally ESEV launched eslogger internally, but since eslogger requires sudo and TCC Full Disk Access and we wanted to release it in the App Store we pulled the feature. May reinsert the feature in the future to the website’s downloadable version if desired.
Usage Design
ESEV is designed for local exploration of events. It currently does not purge old events like Crescendo does, so capturing every event type and letting it run for hours isn’t the best idea. ESEV is designed for interactive analysis and exploration rather than continuous processing.
ESEV loads everything into memory to make exploration fast. If the more common usage scenario turns out to be streaming or gigabyte+ file loads, we can modify how ESEV works to optimize for that usage scenario.
We loaded a 3.2G 1.3M event file:
- 32G M1 system, ~4-minutes to load (responsive)
- 16G Intel i5 system, ~10-minutes to load (mostly responsive), did get a couple of spinning beach balls
- 8G M1 system, ~5-minutes to load (less responsive), more spinning beach balls
1.2G event file loaded and ran smoothly on all systems.
File load speeds can be improved by turning off annotation features in the settings before loading a file.
Possible future features
This is all still up in the air but ideas we were considering:
- Event sequence into Graph view (pid chaining)
- Implement negative filters, in opposition to selective filters these deselect events from view
- Search for multiple categories at the same time (like console.app)
- JSON view colorization, line numbers and flag name expansion
- Add more annotations
- Allow running eslogger from within ESEV (not app store approvable)
- Implement rolling buffer for continuous operation
- Implement ondisk storage for better interactivity with multi-gigabyte files
Credits
We referenced the code for Crescendo by SuprHackerSteve (aka Stephen Davis) while learning Swift and implementing certain features like the Search dropdown.
Leverages JAMF’s Subprocess Swift library for the tail feature.
So many great Mac researchers out there now. For starters, check out The Mitten Mac, The Eclectic Light Company, Cedric Owens, Objective-See, nixhackers and Connor Morley from WithSecure.
Notes
- Executable, Binary and Program are used interchangeably.
- Endpoint Security Framework is now referred to as Endpoint Security API in Apple’s documentation.
- Messages output to oslog are protected by Apple privacy and simply show
<private>in place of the actual log message in the logfile. This makes using oslog less useful unless users reconfigure their Macs to disable message privacy. - Showing entitlements for a program
nub@nubtop ~ % codesign -d --entitlements :- `which eslogger`
- Remember when running eslogger it’s necessary to enable Full Disk Access for Terminal.app (or whatever app is running it). This is described in the eslogger man page.